


Ethereum price has fallen over 6% in the past 24 hours and is currently down about 27% in the past 30 days. The break from the main continuation pattern opened the door to an even deeper decline. At the same time, on-chain signals are flashing a 28% downside window that could be Ethereum’s next cycle bottom if conditions worsen.
Taken together, these signals suggest that the ETH correction may not be complete yet.
sponsored
Do certain long-term indicators indicate room for decline?
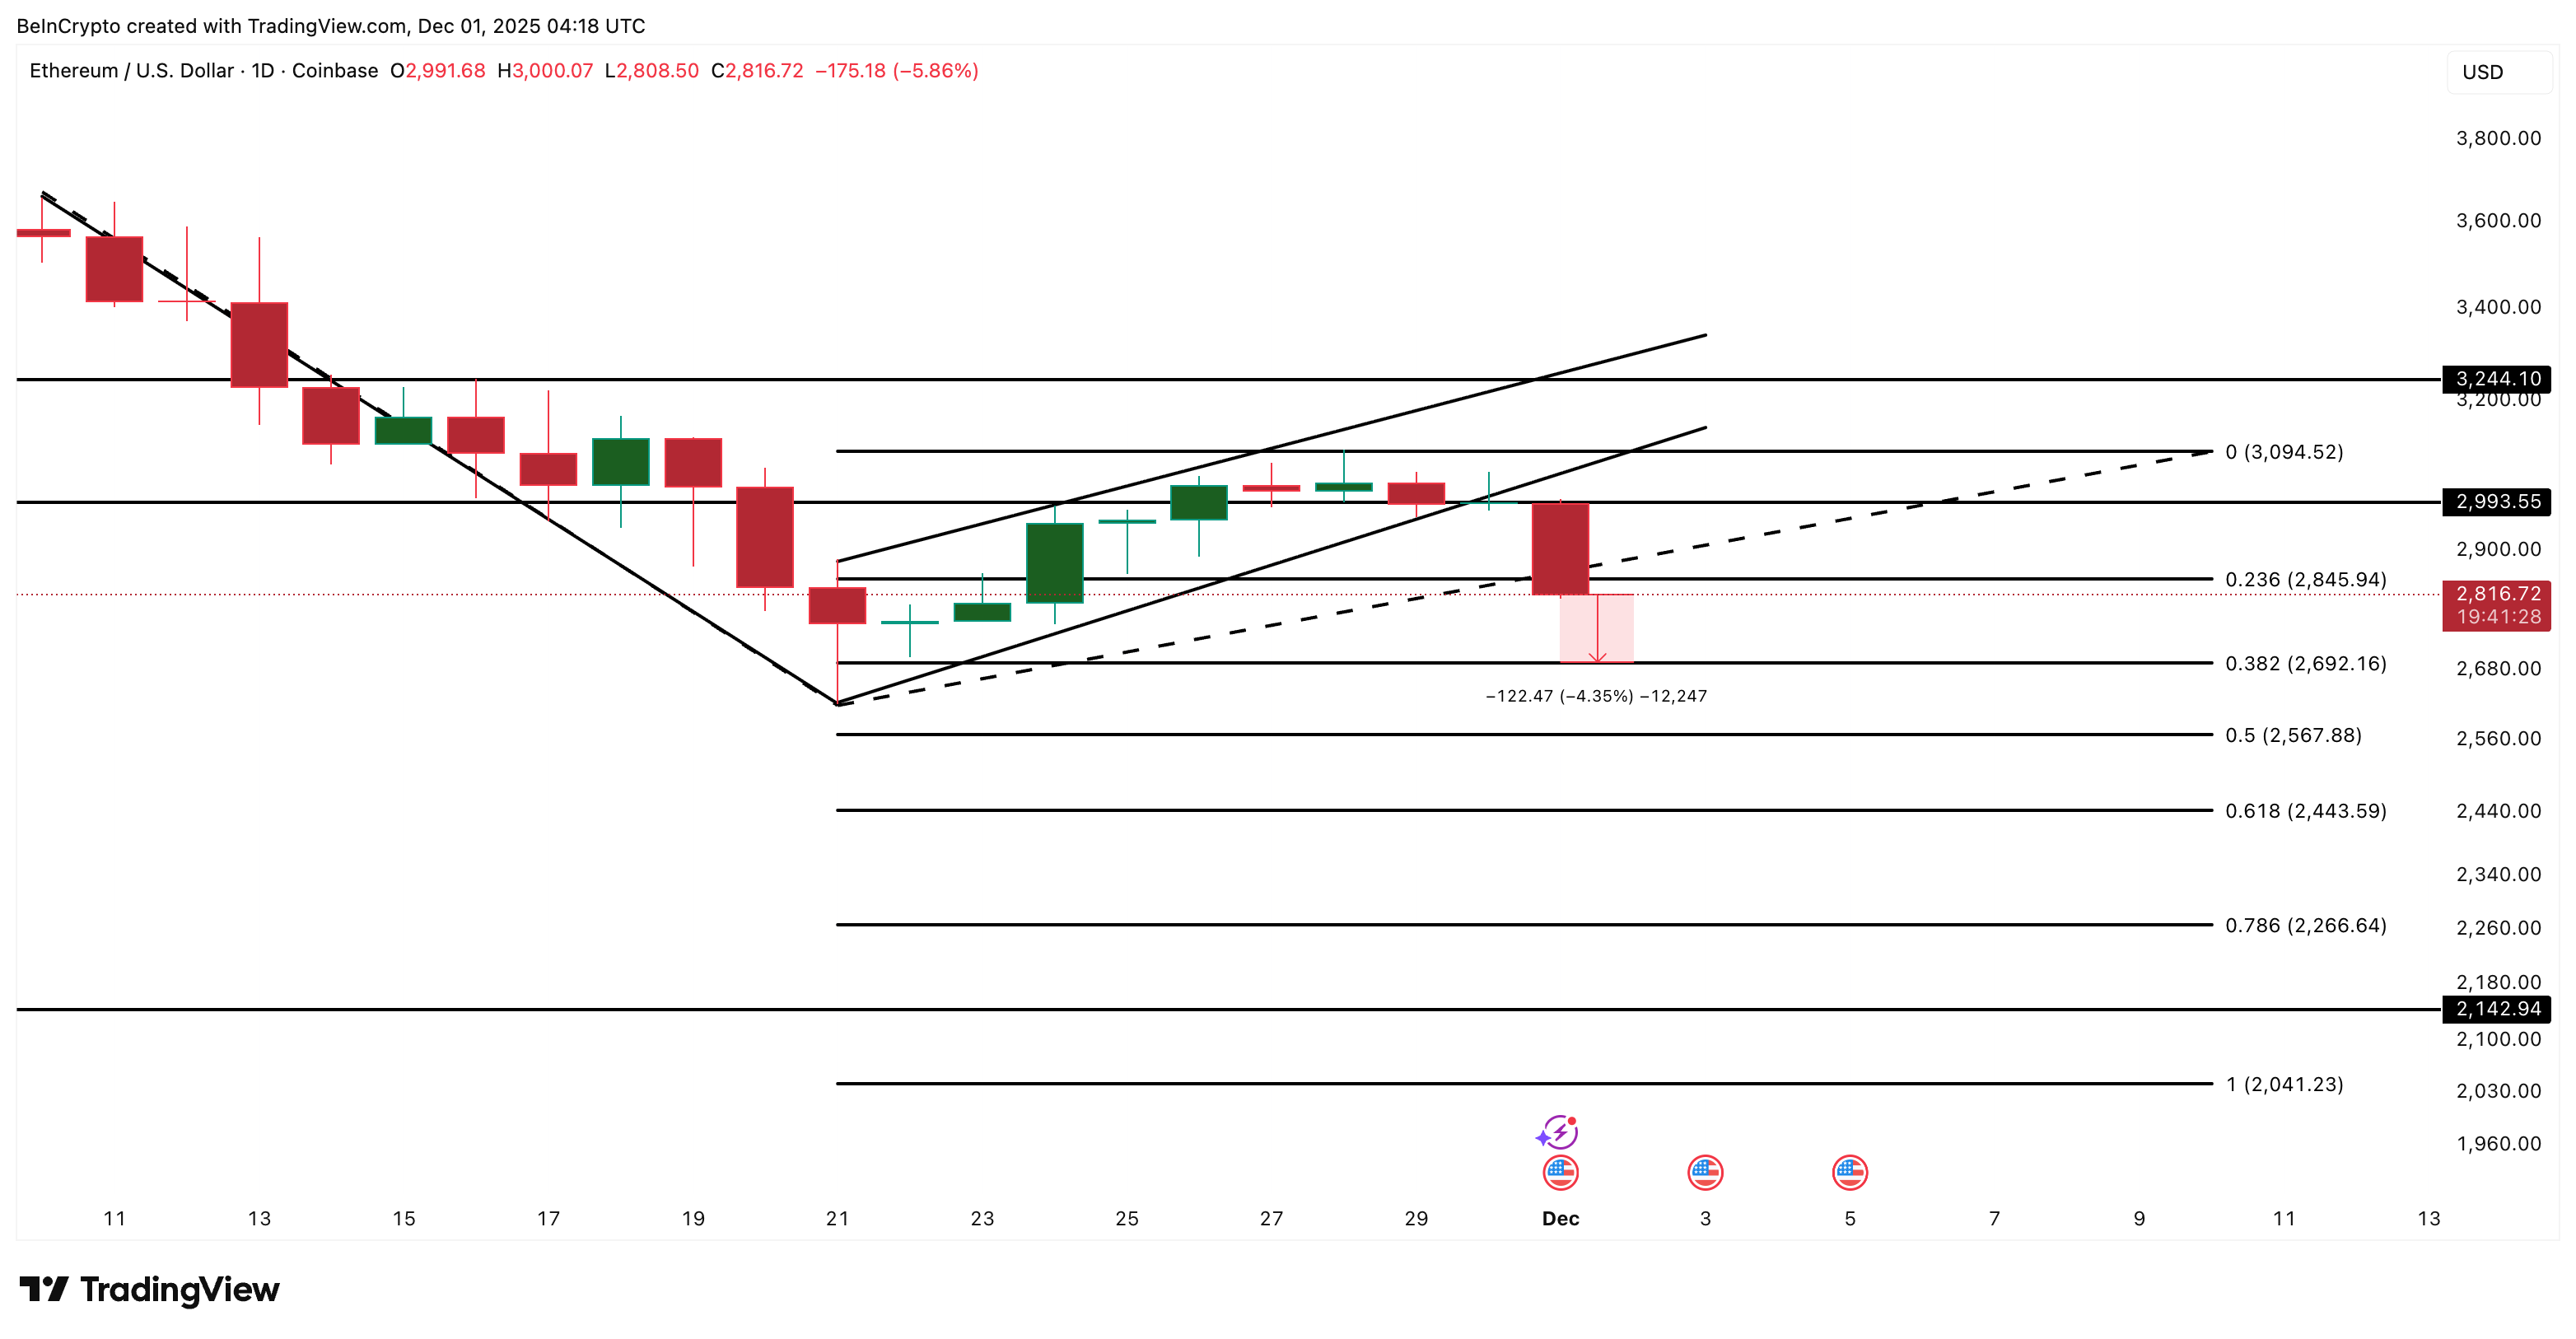
Ethereum recently collapsed from a clean bear flag. The move began after ETH failed at $2,990, breaking out of the ascending channel it had been trading in less than a week. The initial decline created a “pole” with a 28.39% decline, and this breakdown activates a measured target near $2,140, almost exactly 28% below the breakdown level.
Want more token insights like this? Sign up for Editor Harsh Notariya’s Daily Crypto Newsletter here.
To see if this goal makes sense, let’s compare it to long-term holder NUPL. Long Term Holders NUPL measures how much profit long term holders are making.
NUPL has been trending lower since August 22nd, suggesting long-term holders are reducing unrealized gains and tempering confidence. The most recent short-term low was 0.36 on November 21st, while the six-month low was 0.28 recorded on June 22nd, a difference of about 22%.
sponsored
On June 22nd, when NUPL reached 0.28, ETH traded around $2,230, causing a sharp market reversal. From there, Ethereum rose to $4,820, an increase of 116% from its bottom.
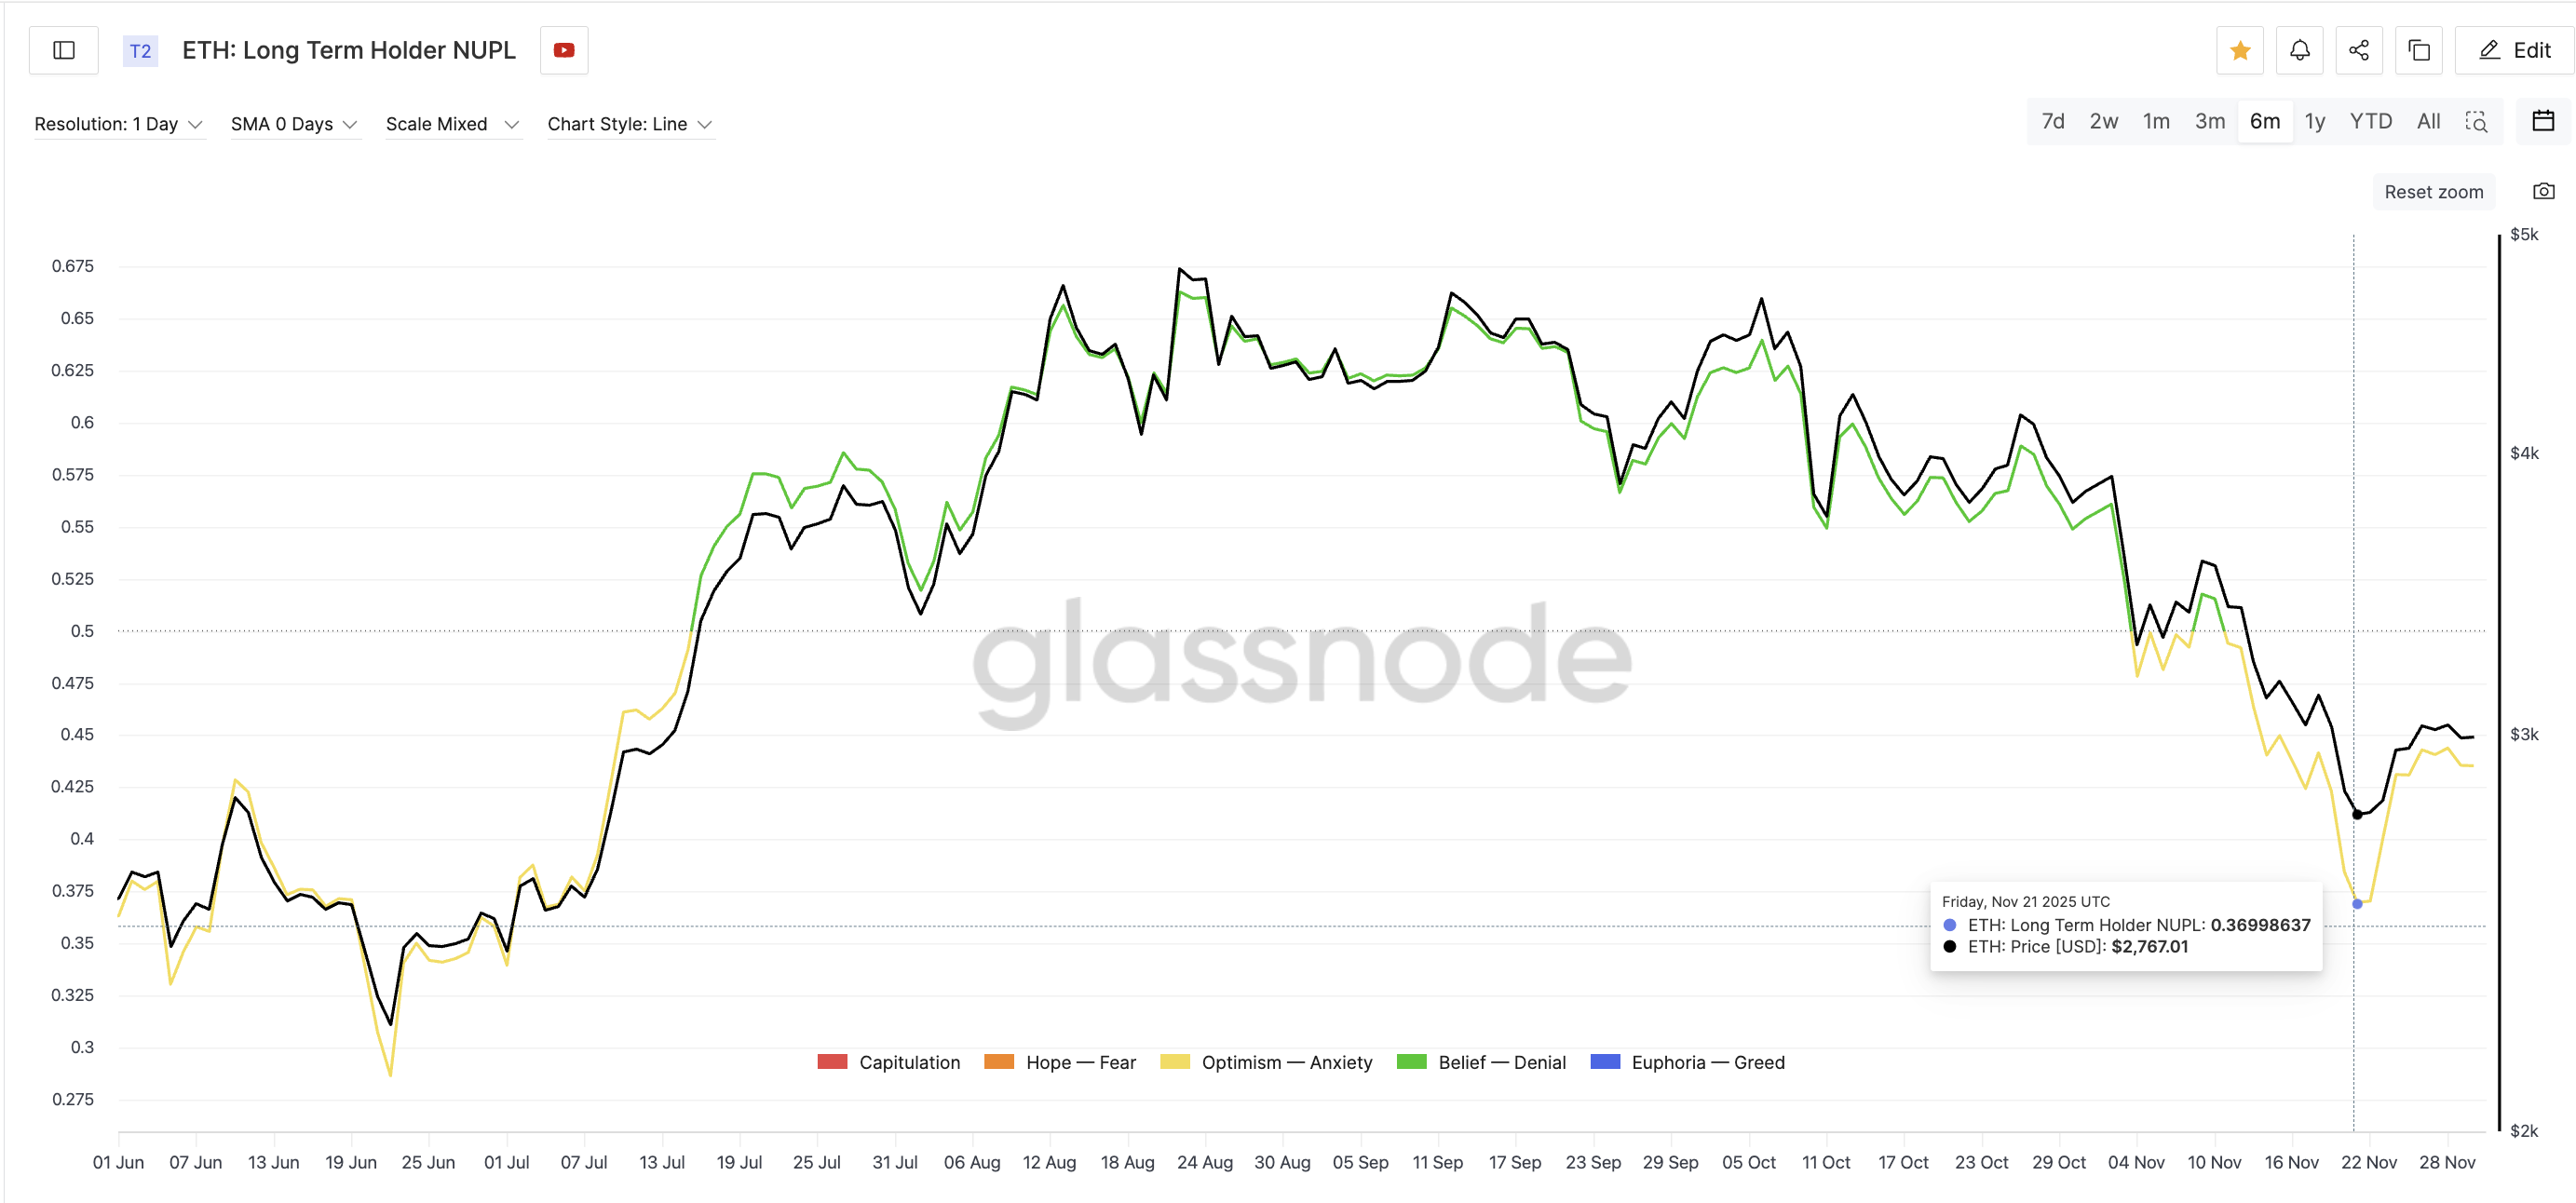
If NUPL retests its 0.28 cycle low band again today, the implied price drawdown from ETH’s recent local high around $2,990 would be in the same 20-25% range, exactly matching the 28% bear flag target of $2,140.
This is the clearest overlap in the entire analysis. Both the price pattern and long-term holder indicators point to the same lower zone.
sponsored
Ethereum price is on the strongest wall on a cost basis
The next step is to see if the Ethereum price chart supports the same conclusion. A cost-based distribution heatmap shows where large ETH clusters have recently accumulated. The heaviest band is between $2,801 and $2,823, with 3,591,002 ETH purchased in that zone. This is the strongest support Ethereum currently has.
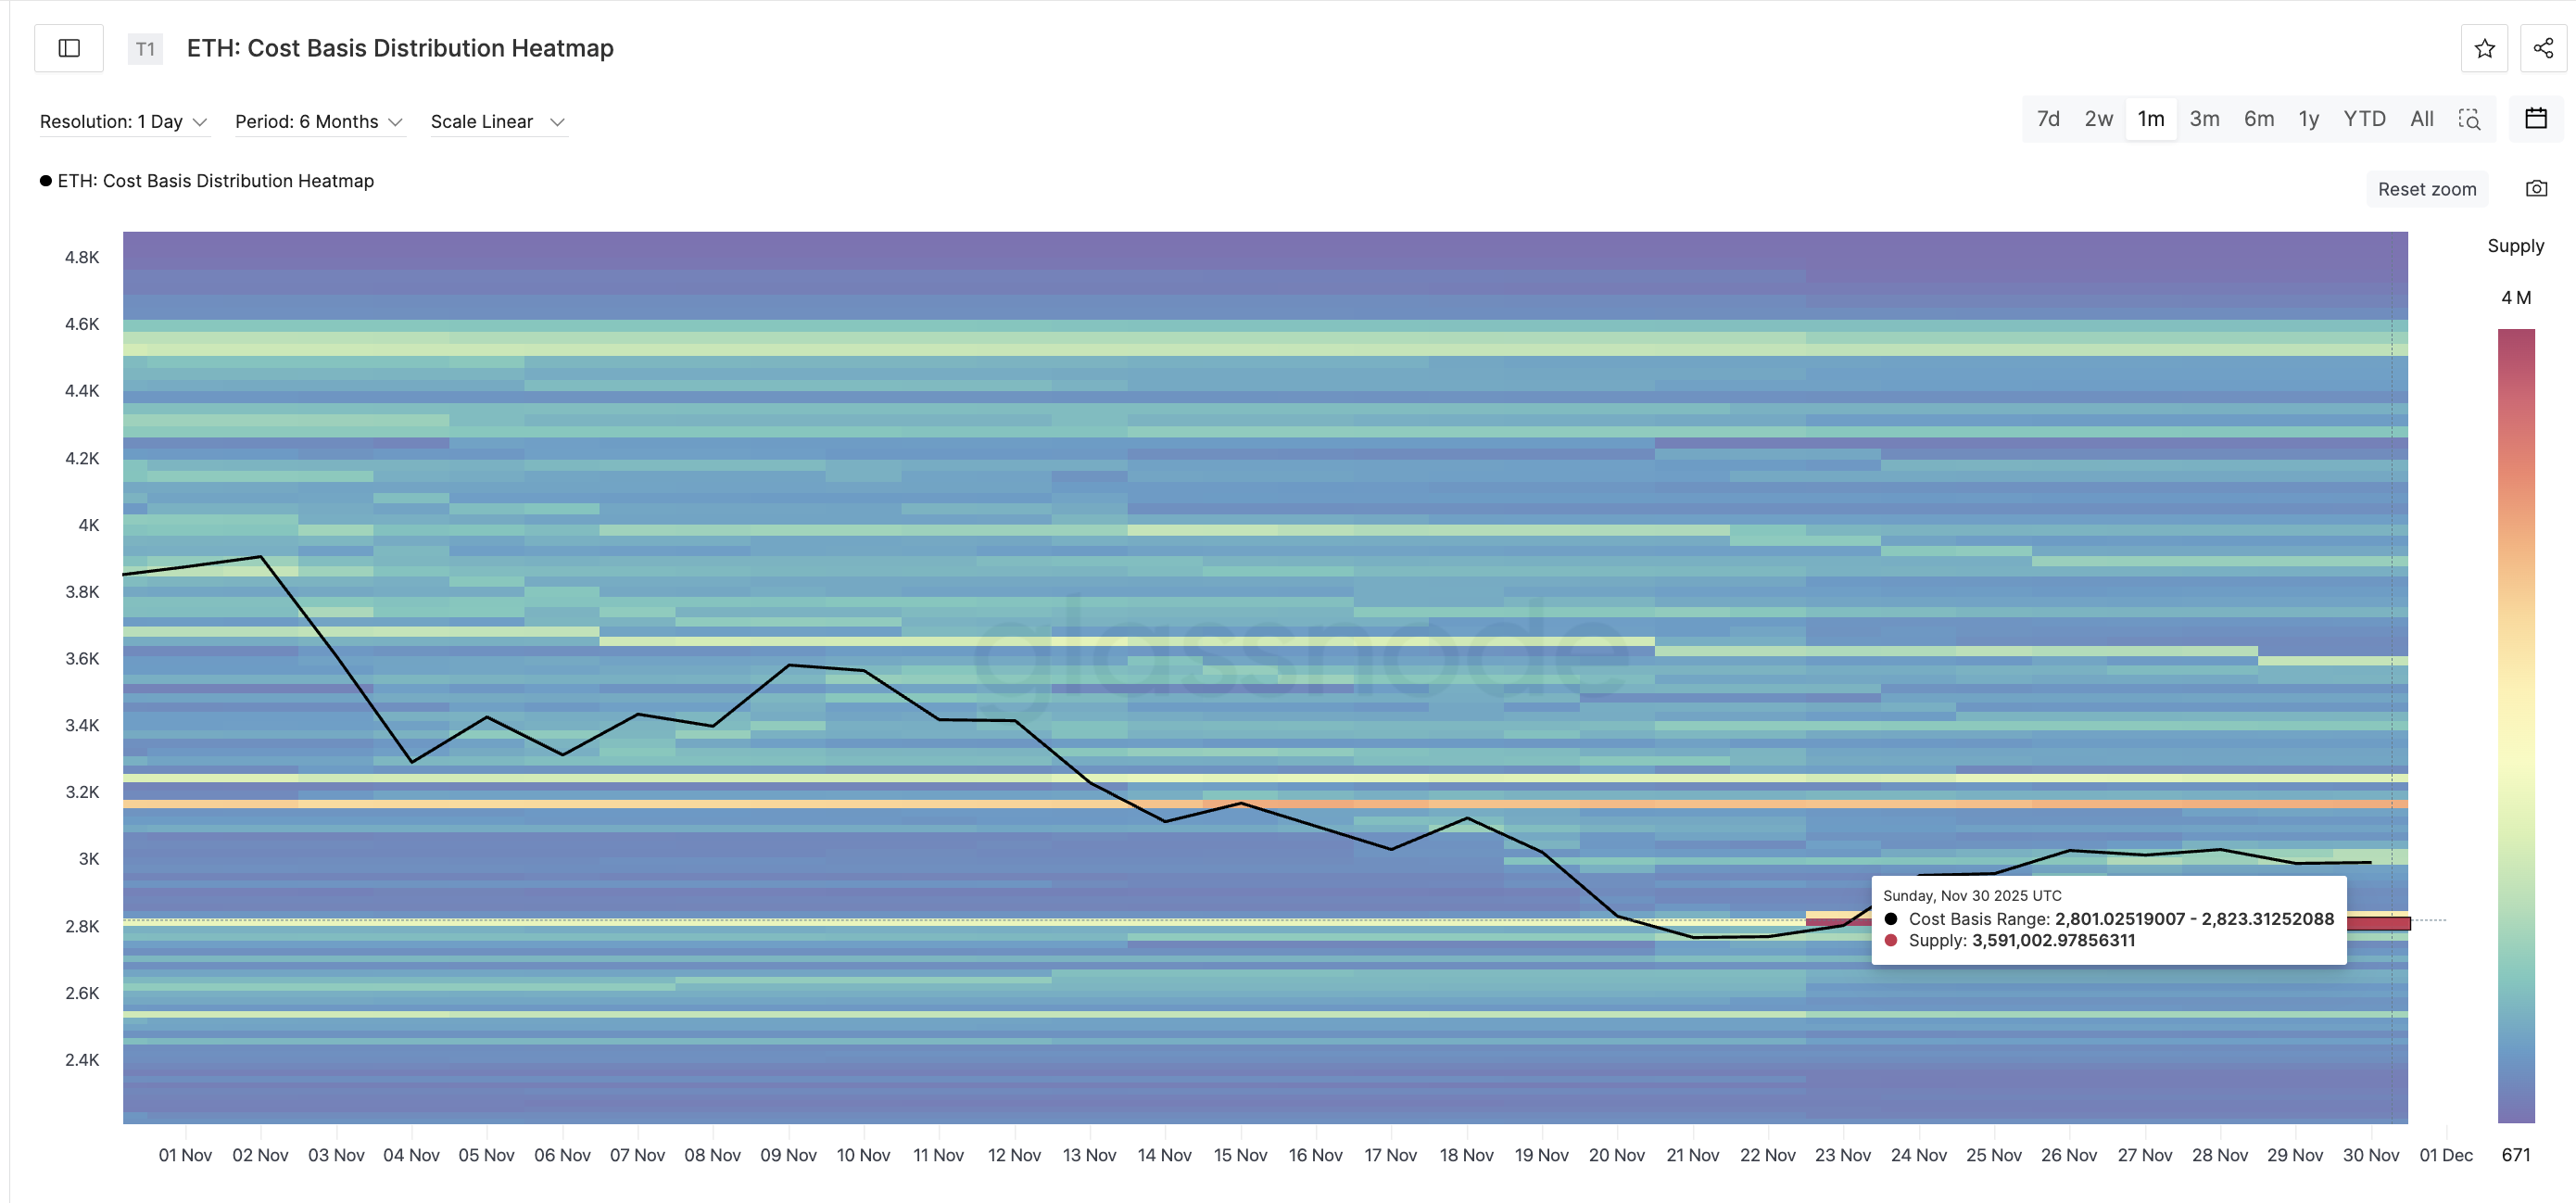
ETH has already fallen below the $2,840 price level, increasing pressure on this cost-based wall. Sellers remain in full control even if ETH price is unable to recover $2,840 quickly and close above $2,990 again.
As the weakness continues, the next level of trend-based extensions emerge one after the other. The first point is $2,690, about 4.5% less than the current price. If that fails, the decline could widen to $2,560 (a further 4.6% decline), $2,440 (another 4.8%), and $2,260, just 2% above June’s NUPL bottom of $2,230.
sponsored
Beneath all of this is a full breakdown target of $2,140, about 28% below the breakdown zone and perfectly in line with the flag’s prediction.
If ETH falls below $2,266, a bear flag target becomes the most realistic scenario.
There is still a nullification path, but it requires several layers of strength. ETH needs to regain $2,840, then break above $2,990, and then secure a close above $3,090. The overall bearish pattern will only lose meaning if ETH breaks through $3,240, which is about a 15% increase from current levels.
For now, ETH is trading under the strongest cost-based wall, long-term holders are still reducing unrealized gains, and the continuation structure is clearly declining. If these conditions hold true, the $2,260-$2,140 area is where Ethereum is most likely to form its next cycle bottom.